
Prenatal diagnosis became a reality almost 40 years ago, when advances in microscopy and cell culture made it possible to examine chromosomes in fetal cells drawn from amniotic fluid—the familiar karyotype analysis. Technical advances continue to sharpen the resolution of routine karyotype analysis on amniotic fluid or a specimen of chorionic villus, and to raise the level of detail obtained from such a study.
Yet examining chromosomes by light microscopy remains time- and labor-intensive. A cell culture typically requires 2 weeks before growth of cells is sufficient to undertake a karyotype analysis—after which the microscopic evaluation requires further time and significant skill to perform.
Change is coming to practice
Over the past 10 years, however, the human genome project has produced technologies that allow us to examine DNA at a level of resolution unattainable when chromosomes are evaluated under a light microscope. The exciting news is that these research technologies are being transferred to the clinical arena, where they will transform prenatal diagnosis and counseling in your practice.
One such technology that will have such a far-reaching effect, and that I focus on in this “Update,” is known as molecular karyotyping.
What is “molecular karyotyping”? How is it performed?
Refinements to hybridization technology yield new tools; a new term enters the lexicon of prenatal diagnosis
Vermeesch JR, Melotte C, Froyen G, et al. Molecular karyotyping: array CGH quality criteria for constitutional genetic diagnosis, J Histochem Cytochem. 2005;53:413–422.
Van den Veyver I, Beaudet A. Comparative genomic hybridization and prenatal diagnosis. Curr Opin Obstet Gynecol. 2006;18:185–191.
So-called molecular karyotyping utilizes the evolving technology of comparative genomic hybridization by microarray (or, simply, array CGH), which is a refinement of older CGH technology. Initial work with whole-genome hybridization involved applying fragmented and fluorescently labeled subject DNA to a normal metaphase chromosome spread. Deletions or duplications within the subject DNA were then made evident by reduced, or increased, fluorescence at complementary sites along the metaphase chromosomes. The resolution afforded by this approach was comparable to that of light microscopy—namely, alterations of at least 5 to 10 megabases (Mb) could be detected.
Array technology emerged in the late 1990s and increased the resolution of genome hybridization by at least 10-fold. How does it work?
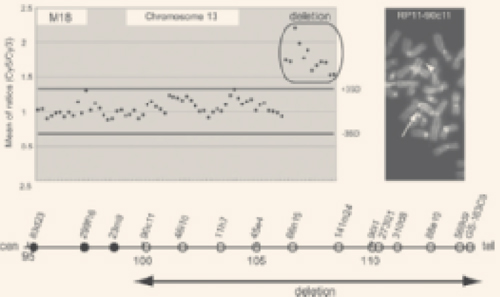
FIGURE 1
Sample display of array CGH and corresponding FISH analysis
At left: Hybridization ratios of normal sex-matched control DNA (Cy5) to sample DNA (Cy3) are plotted as a function of Cy5/Cy3 signal intensity. (Note that ratios of deleted clones are greater than +3SD.)
At right: Fluorescence in situ hybridization (FISH) analysis demonstrates intact (arrows) and deleted (arrowheads) signals.
Bottom: Clones are summarized schematically.
Modified from Yamagata et al. Am J Med Genet. 2006;140A:205–211.
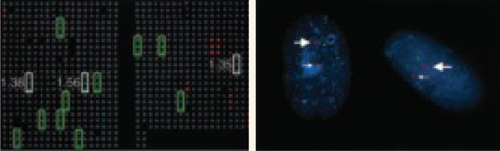
FIGURE 2
Array CGH reveals a duplicated chromosome 15q
At left: Analysis by array CGH demonstrates trisomy 16 and duplication of the Prader-Willi/Angelman syndrome region on chromosome 15q in this patient. Each clone is spotted in triplicate on the array; clones with a gain in the specimen are represented in green; those with a loss, in red; and those with a normal copy number, in gray. Green boxes mark chromosome 16 clones that demonstrate trisomy. White boxes highlight clones from the Prader-Willi/Angelman syndrome region that are duplicated; corresponding ratios are shown next to each target. Other red and green signals correspond to clones from, respectively, the X and Y chromosomes.
At right: Interphase FISH analysis confirms the interstitial duplication of chromosome 15q that was identified by array CGH. The small arrow in each cell points to the normal signal for the SNRPN (Prader-Willi) gene; the large arrow indicates duplicated chromosome 15q, which shows two hybridization signals for SNRPN.
Modified from Schaffer. Am J Human Genet. 2004;74:1168.
Array CGH is still new but already being improved
The 1st generation of array CGH slides covered the entire human genome with DNA fragments spaced approximately 1 Mb apart. Refinements have produced arrays of more than 30,000 overlapping DNA fragments. Such resolution allows detection of a gain or loss of segments as small as 100 to 200 kilobases (Kb). Compare this resolution with the best resolution of traditional microscopic cytogenetic analysis: approximately 5 Mb.